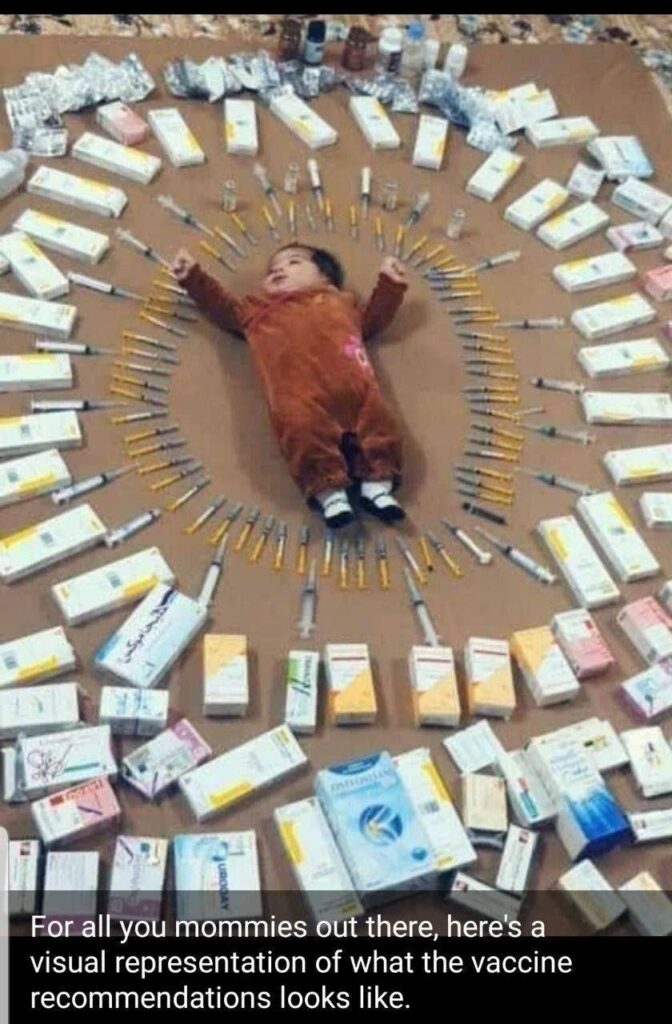
First lets remind everyone what the vaccine schedule looks like for children, and it’s actually missing the new gene therapy recommendation.
The article makes the case explicitly clear. So don’t let them poison and harm your child. And the vaccines are also responsible for SIDS because babies can’t handle the toxic stew being injected into their bodies.
In January 2023, the CDC presented its 2018 survey of autism among eight-year-old American children. The most recent numbers show 1 in 54 kids have autism, nearly triple from 2002, when the number was 1 in 160.
Mainstream science expects autism numbers to rise. Since WWII, data on children with autism is well-documented. Lotter (1966) examined eight-to ten-year-olds in Middlesex, UK, and estimated 4.5 per 10,000 children. Contemporary American estimates of the early 1970s were slightly lower at 2 per 10,000 (see Weintraub 2011). When Newschaffer et al. (1992) looked, it jumped to 19 per 10,000 in six-year-olds. Writing in Nature, Weintraub (2011) said that the autism rate in the United States, for 2009, was 1 per 110 (about 90 per 10,000).
Before it was deleted from YouTube, I saw a presentation by Dr. Kenneth Stoller. (See it here). Stoller explains: autism is encephalopathy; that is, ‘children, with brain damage, from a toxicological burden, often caused by vaccines, have autism.’
“Aluminum and mercury are often, simultaneously administered to infants … [yet] there is absolutely no data, [not even] animal data, about the potential for synergy, additivity … [to] allow us to draw any conclusions [about] simultaneous exposure to these two [metals] in vaccines” (page 20).
Another attendee, Thomas Verstraeten, presented findings on the positive correlation between exposure to thimerosal-containing vaccines with neurological damage and physical disability. Months later, Verstraeten would compile a report concluding that if a child received 25 (or more) micrograms of thimerosal, from vaccines, rates of disease and diagnoses were (in descending order):
- ADHD: 11.35 times more likely;
- Autism: 7.62 times more likely;
- ADD: 6.38 times more likely;
- Tics: 5.65 times more likely; and
- Speech and Language Delay: 2.08 times more likely.