From Sen. Ron Johnson’s roundtable on Covid-19 vaccines efficacy and safety where insurance research analyst Josh Stirling provided the following chart and information. The link at bottom has the video clip. And notice all who were invited but refused to attend. We’ll recap, we’re looking at an increase of 600k deaths per year. And they still won’t stop promoting the highly experimental gene therapy which we’ve learned wasn’t effective at anything except killing those that took it. If you did take it, you need to look into things that can help detox your body as well as things that can help repair your immune system.
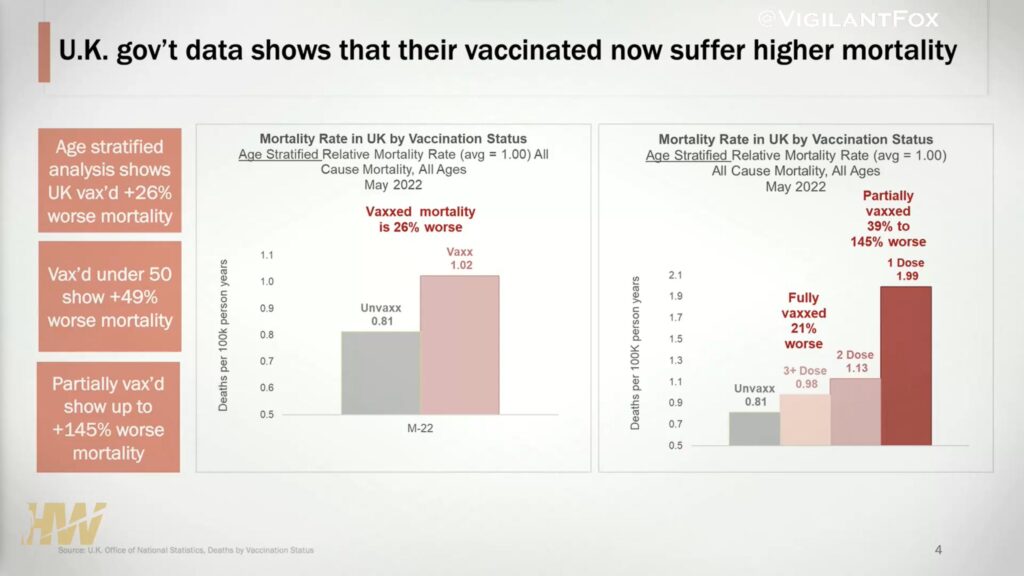
“The people who are under the age of 50 who took the vaccine now have a 49% higher mortality rate.”
“It just doesn’t make a ton of sense unless you realize that what’s going on with this really is that the people who took the dose, the first dose in the United States — that’s about 12% of people — but then stop taking any other doses, those people, through their choice to stop, disproportionately [were] the ones who are harmed,” explained Stirling.
“And so, what we’re concluding is that if you happen to be an unlucky person who was in some fashion, even moderately injured [or] with a minor injury [and] have decided not to continue, the statistics, the best statistics we have show that you’re gonna have, at least through today, maybe it’ll get better … but if that doesn’t happen we’d have to assume that this is now the baseline, there’s going to be 145% higher mortality. And if you were to take these numbers and just apply them to the United States, that ends up being something like 600,000 excess deaths per year in the United States from this higher vaccine-induced mortality.”